Outfancy: A Terminal Data Visualization Library Created as a Learning Project
Introduction
Back in 2014, when I was 16 years old and eager to explore Python programming, I developed Outfancy, a simple terminal-based data visualization library. It was one of my early projects, built primarily as a learning experience. At the time, I wanted a way to print tables and charts in the terminal without complicated dependencies. In that era, there weren’t many libraries addressing that specific need.
Why I Built Outfancy
At the time, I was experimenting with various ways to structure data output for CLI applications and wanted to create a tool that could:
-
Print Data in Tables: Display structured data in an easy-to-read format directly in the terminal.
-
Update Real-Time Data: Print one-line updates for monitoring purposes.
-
Use Minimal Dependencies: Keep the library lightweight for simple projects.
-
Experiment with Python Concepts: The project helped me explore object-oriented programming and basic rendering techniques.
Outfancy was born out of curiosity rather than a production need, but it still served as a practical learning tool for working with terminal outputs and formatting data structures.
How Outfancy Works
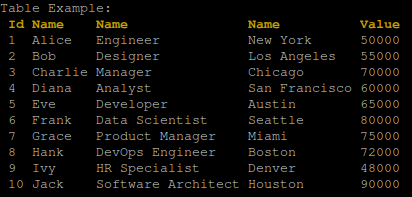
Outfancy was designed for simplicity. Here’s an example of how it prints tables in the terminal:
import outfancy.table
import time

# Example 1: Printing a larger table with more columns and data
dataset = [
    (1, 'Alice', 'Engineer', 'New York', 50000),
    (2, 'Bob', 'Designer', 'Los Angeles', 55000),
    (3, 'Charlie', 'Manager', 'Chicago', 70000),
    (4, 'Diana', 'Analyst', 'San Francisco', 60000),
    (5, 'Eve', 'Developer', 'Austin', 65000),
    (6, 'Frank', 'Data Scientist', 'Seattle', 80000),
    (7, 'Grace', 'Product Manager', 'Miami', 75000),
    (8, 'Hank', 'DevOps Engineer', 'Boston', 72000),
    (9, 'Ivy', 'HR Specialist', 'Denver', 48000),
    (10, 'Jack', 'Software Architect', 'Houston', 90000)
]

table = outfancy.table.Table()
print("Table Example:")
print(table.render(dataset))

Outfancy automatically adapts column widths based on the content, making the tables more readable. I also implemented a heuristic system to guess the data type and use it for naming column labels automatically.
Alternatively, you can manually specify the column headers like this:
print(table.render(dataset, label_list=["Id", "Name", "Surname", "City", "Salary"]))
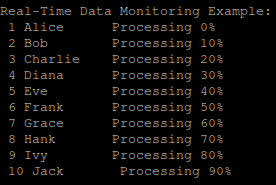
Outfancy also supports basic real-time data monitoring using the Oneline feature:
# Example 2: Real-time data monitoring with Oneline feature
oneline_table = outfancy.table.Oneline()

print("\nReal-Time Data Monitoring Example:")
for i in range(10):
    data = [dataset[i][0], dataset[i][1].ljust(10), f"Processing {i*10}%"]
    print(oneline_table.render(data))
    time.sleep(1)

Outfancy includes an experimental feature for creating line charts, enabling numerical data visualization in a terminal-friendly format. This functionality uses ASCII characters to render basic line plots, making it easy to perform simple data analysis directly from the command line.
A better option for this today is: https://github.com/tammoippen/plotille
These features were a great way for me to experiment with different aspects of Python, such as handling loops, string formatting, and modular design.
Alternatives
Today, more mature options such as rich and tabulate also offer functionality for terminal data visualization, Outfancy still serves its original purpose well: making terminal data visualization clean and efficient without unnecessary complexity.
Conclusion
Outfancy was one of my first steps into Python programming, and while it may not be the best choice for terminal data visualization today, it represents an important part of my growth as a developer. If you’re just starting out with Python, don’t be afraid to build small tools like this—every experiment teaches you something new.
Explore Outfancy on GitHub: